

Central Homes and Nautilus
The middle of the island, from 23rd Street to 63rd Street
ALERTS FOR CENTRAL HOMES AND NAUTILUS
E-mail me when
Rentals. Sign in to follow
How often
Find it any time in My Zilbert › Searches & Alerts. Change or stop the emails there.
About Central Homes and Nautilus
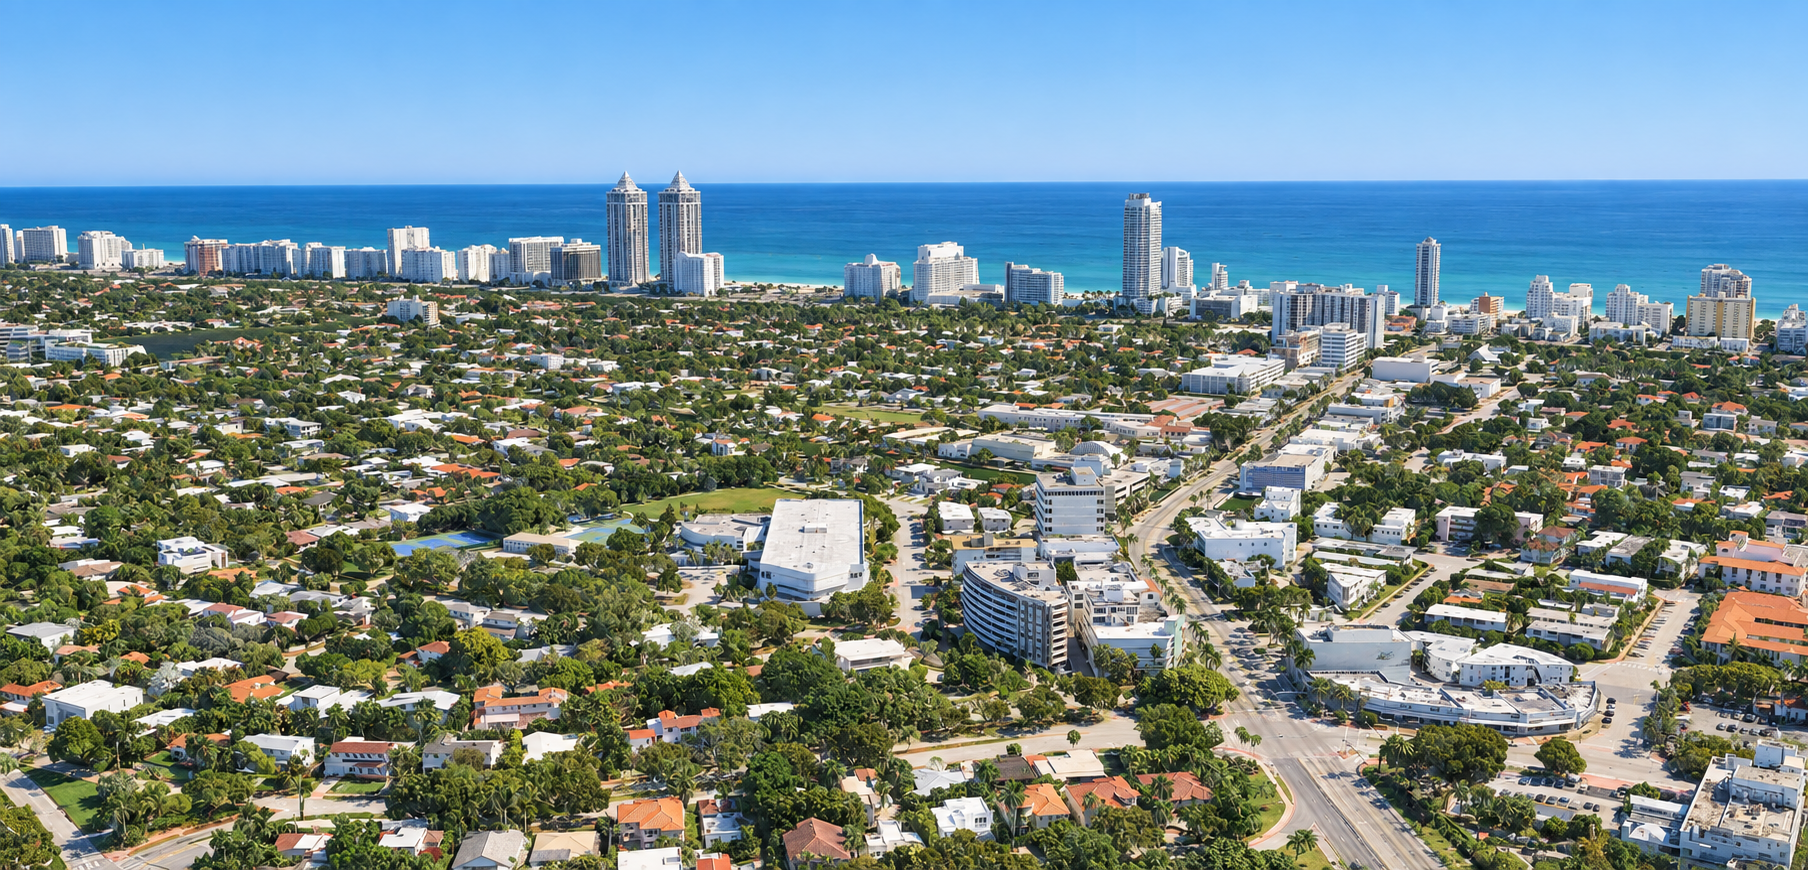
The central section of Miami Beach from roughly 23rd Street to 63rd Street, where Collins Avenue curves along the ocean past the storied Fontainebleau and Eden Roc — the stretch nicknamed Millionaires' Row in the 1950s. Today it mixes oceanfront condo towers and hotel-branded residences, notably the Faena District's arts-anchored redevelopment around 32nd–33rd Streets, with single-family neighborhoods along Indian Creek to the west.
By Mark Zilbert, Global Real Estate Advisor · updated October 2026
Zilbert features 55 condos and 44 single family homes for sale in Central Homes and Nautilus today.

Condos in Central Homes and Nautilus
Sorted by name. Every condo has a page whether or not anything is for sale. Sales history carries the quiet ones.
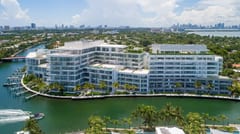
For Sale
55 condos for sale across 4 buildings in Central Homes and Nautilus, sorted by price.
Showing listings from $350,000 · 12 more below this price · Show all
| Building ⇅ | Price ⇅ | Listed ⇅ |
|---|---|---|
| 4701 North MeridianUnit N01 4 bed · 4,168 SqFt | $7,999,000$1,919/SqFt · ▼8.0% | 4/30/264/30 |
| Ritz-Carlton ResidencesUnit 512 4 bed · 4,204 SqFt | $7,775,000$1,849/SqFt | 10/2/2610/2 |
| Ritz-Carlton ResidencesUnit 627 3 bed · 3,835 SqFt | $7,575,000$1,975/SqFt | 4/24/264/24 |
| Ritz-Carlton ResidencesUnit 222 2 bed · 2,878 SqFt | $5,500,000$1,911/SqFt | 9/26/259/26/25 |
| Ritz-Carlton ResidencesUnit 421 3 bed · 3,140 SqFt | $4,999,999$1,592/SqFt · ▼4.8% | 7/14/267/14 |
| Ritz-Carlton ResidencesUnit 304 3 bed · 2,668 SqFt | $4,495,000$1,685/SqFt | 10/26/2610/26 |
| Ritz-Carlton ResidencesUnit 311 3 bed · — SqFt | $4,495,000 | 10/7/2610/7 |
| Golf Course Sub Amd PlTH 04 4 bed · 2,770 SqFt | $3,950,000$1,426/SqFt · ▲1.3% | 4/6/264/6 |
| Golf Course Sub Amd PlTH 08 4 bed · 3,391 SqFt | $3,950,000$1,165/SqFt · ▲31.9% | 8/7/258/7/25 |
| Ritz-Carlton ResidencesUnit 209 2 bed · 1,749 SqFt | $2,525,000$1,444/SqFt · ▼2.9% | 7/2/267/2 |
| The Ths At Sunset HarbourUnit 202 3 bed · 2,640 SqFt | $2,300,000$871/SqFt | 3/6/263/6 |
| Meridian LoftsUnit 101 2 bed · 2,057 SqFt | $2,200,000$1,070/SqFt | 5/26/265/26 |
| Meridian LoftsUnit 307 2 bed · 2,058 SqFt | $1,950,000$948/SqFt · ▼18.2% | 11/4/2511/4/25 |
| Meridian LoftsPH 16 2 bed · 1,809 SqFt | $1,895,000$1,048/SqFt | 7/24/267/24 |
| Tower Forty OneUnit 926,925 2 bed · 2,133 SqFt | $1,800,000$844/SqFt | 8/14/268/14 |
| Bel Aire on the OceanUnit 1403 2 bed · 1,126 SqFt | $1,775,321$1,577/SqFt | 9/23/269/23 |
| Bel Aire on the OceanUnit 1709 2 bed · 1,128 SqFt | $1,475,000$1,308/SqFt | 10/7/2610/7 |
| Meridian LoftsUnit 309 2 bed · 1,450 SqFt | $1,110,000$766/SqFt · ▼20.1% | 9/4/269/4 |
| Meridian LoftsPH 21 1 bed · 966 SqFt | $925,000$958/SqFt | 7/2/267/2 |
| Meridian LoftsUnit 404 2 bed · 966 SqFt | $899,000$931/SqFt | 5/11/265/11 |
| Meridian LoftsUnit 517 1 bed · 966 SqFt | $899,000$931/SqFt · ▼30.8% | 4/9/244/9/24 |
| The EwingUnder ContractUnit 1 3 bed · 1,393 SqFt | $890,000$639/SqFt · ▼3.3% | 5/1/265/1 |
| 2020 LoftsUnit 404 2 bed · 1,056 SqFt | $829,000$785/SqFt | 10/9/2610/9 |
| Bel Aire on the OceanUnit 1505 1 bed · 819 SqFt | $800,000$977/SqFt | 9/18/269/18 |
| Bel Aire on the OceanUnit 1405 1 bed · 819 SqFt | $800,000$977/SqFt | 9/3/269/3 |
| Bel Aire on the OceanUnit 1801 1 bed · 819 SqFt | $778,000$950/SqFt | 8/14/268/14 |
| Meridian LoftsUnit 518 1 bed · 966 SqFt | $699,000$724/SqFt | 8/15/268/15 |
| Bel Aire on the OceanUnit 710New 1 bed · 881 SqFt | $675,000$766/SqFt | 10/31/2610/31 |
| 2020 LoftsUnit 302 2 bed · 1,043 SqFt | $649,900$623/SqFt | 8/11/268/11 |
| Meridian LoftsUnit 516 1 bed · 966 SqFt | $649,000$672/SqFt | 9/23/269/23 |
| Meridian LoftsUnit 506 1 bed · 966 SqFt | $649,000$672/SqFt | 10/2/2610/2 |
| Tower Forty OneUnit 919 1 bed · 820 SqFt | $618,990$755/SqFt · ▼1.0% | 3/2/263/2 |
| Tower Forty OneUnit 1105 1 bed · 835 SqFt | $599,000$717/SqFt | 8/23/268/23 |
| 1818 Meridian HouseUnit 4 2 bed · 812 SqFt | $599,000$738/SqFt | 1/4/251/4/25 |
| Meridian LoftsUnit 512 1 bed · 915 SqFt | $560,000$612/SqFt · ▼3.4% | 11/29/2511/29/25 |
| 1818 Meridian HouseUnit 13 2 bed · 851 SqFt | $499,000$586/SqFt | 1/4/251/4/25 |
| 1818 Meridian HouseUnit 5 2 bed · 820 SqFt | $499,000$609/SqFt | 1/4/251/4/25 |
| 1800 MeridianUnit 7 1 bed · 700 SqFt | $449,000$641/SqFt | 9/2/269/2 |
| 1818 Meridian HouseUnit 18 2 bed · 809 SqFt | $438,000$541/SqFt | 10/7/2510/7/25 |
| 2421 Lake Pancoast DrUnit 3B 0 bed · 502 SqFt | $425,000$847/SqFt | 9/24/269/24 |
| The MeridianUnit 701 1 bed · 672 SqFt | $415,000$618/SqFt · ▼1.0% | 8/9/268/9 |
| Pine Tree PlaceUnit 206 1 bed · 603 SqFt | $395,000$655/SqFt · ▼6.0% | 8/10/268/10 |
| 2421 Lake Pancoast DriveUnit 4D 0 bed · 536 SqFt | $385,000$718/SqFt | 8/10/268/10 |
44 single-family homes for sale in Central Homes and Nautilus.
| Address ⇅ | Price ⇅ | Listed ⇅ |
|---|---|---|
| 4521 Pine Tree DriveHome 9 bed · — SqFt | $39,995,000 · ▼5.9% | 10/5/2610/5 |
| 3681 Flamingo DriveNewHome 6 bed · 8,794 SqFt | $37,500,000$4,264/SqFt | 10/28/2610/28 |
| 4395 Pine Tree DriveHome 8 bed · 9,583 SqFt | $36,500,000$3,809/SqFt | 10/13/2610/13 |
| 2499 N Meridian AvenueHome 6 bed · 5,151 SqFt | $12,450,000$2,417/SqFt · ▼3.5% | 2/11/262/11 |
| 3746 Chase AvenueHome 13 bed · 6,949 SqFt | $9,600,000$1,381/SqFt | 9/16/269/16 |
| 1800 Michigan AvenueHome SiteHome Site — bed · — SqFt | $8,999,999 | 10/21/2610/21 |
| 1800 Michigan AvenueHome 0 bed · 4,092 SqFt | $8,999,999$2,199/SqFt | 10/21/2610/21 |
| 1041 W 48th StreetHome 4 bed · 4,737 SqFt | $8,995,000$1,899/SqFt · ▼17.5% | 9/22/269/22 |
| 1278 W 27th StNewHome 6 bed · 4,464 SqFt | $7,499,000$1,680/SqFt | 10/27/2610/27 |
| 4430 Nautilus DriveHome 7 bed · 4,501 SqFt | $7,295,000$1,621/SqFt | 6/17/266/17 |
| 4560 Prairie AvenueHome 5 bed · 4,416 SqFt | $7,000,000$1,585/SqFt | 8/31/268/31 |
| 2887 Pine Tree DriveHome 6 bed · 5,181 SqFt | $6,799,000$1,312/SqFt · ▼2.2% | 3/5/263/5 |
| 2802 Prairie AvenueHome 5 bed · 4,750 SqFt | $6,750,000$1,421/SqFt | 9/9/269/9 |
| 3310 Garden AvenueHome 6 bed · 5,168 SqFt | $6,300,000$1,219/SqFt · ▼3.1% | 3/19/263/19 |
| 3426 Prairie AvenueHome 6 bed · 3,759 SqFt | $6,150,000$1,636/SqFt | 10/13/2610/13 |
| 2534 Flamingo DriveHome 4 bed · 3,168 SqFt | $5,950,000$1,878/SqFt | 10/13/2610/13 |
| 4515 N Michigan AvenueHome 4 bed · 3,994 SqFt | $5,950,000$1,490/SqFt | 9/21/269/21 |
| 3325 Pine Tree DriveHome 3 bed · 3,350 SqFt | $5,950,000$1,776/SqFt | 1/28/261/28 |
| 2050 Alton RoadHome 6 bed · 5,344 SqFt | $5,495,000$1,028/SqFt · ▼15.4% | 6/11/256/11/25 |
| 3748 Prairie AvenueHome 6 bed · 4,892 SqFt | $5,200,000$1,063/SqFt | 5/14/265/14 |
| 2225 Meridian AveHome 4 bed · 3,353 SqFt | $4,987,500$1,487/SqFt · ▼5.0% | 10/5/2610/5 |
| 2880 Fairgreen DriveHome SiteHome Site — bed · — SqFt | $4,950,000 · ▼5.7% | 3/5/263/5 |
| 2880 Fairgreen DriveHome 5 bed · 3,626 SqFt | $4,950,000$1,365/SqFt · ▼5.7% | 3/5/263/5 |
| 1753 Michigan AvenueHome 10 bed · 4,056 SqFt | $4,799,000$1,183/SqFt | 9/25/269/25 |
| 510 W 30th StreetHome 6 bed · 3,926 SqFt | $4,150,000$1,057/SqFt | 9/16/269/16 |
| 3121 Prairie AvenueHome 4 bed · 2,405 SqFt | $3,950,000$1,642/SqFt | 9/16/269/16 |
| 4470 Alton RoadHome 2 bed · 2,197 SqFt | $3,900,000$1,775/SqFt | 12/11/2512/11/25 |
| 4430 Alton RoadHome 5 bed · 3,581 SqFt | $3,787,000$1,058/SqFt | 7/24/267/24 |
| 939 W 47th CourtHome 5 bed · 3,630 SqFt | $3,750,000$1,033/SqFt · ▼5.1% | 7/1/267/1 |
| 1735 Lenox AvenueHome 5 bed · 2,646 SqFt | $3,600,000$1,361/SqFt | 10/26/2610/26 |
| 2388 Prairie AvenueUnder ContractHome 5 bed · 3,677 SqFt | $3,525,000$959/SqFt · ▼9.6% | 8/18/268/18 |
| 3758 Prairie AvenueHome 4 bed · 2,525 SqFt | $3,200,000$1,267/SqFt | 5/15/265/15 |
| 4353 Alton RoadHome 4 bed · 3,080 SqFt | $2,999,000$974/SqFt | 9/23/269/23 |
| 1710 Jefferson AvenueHome SiteHome Site — bed · — SqFt | $2,800,000 · ▼17.6% | 4/4/244/4/24 |
| 3722 Royal Palm AvenueHome 3 bed · 2,452 SqFt | $2,690,000$1,097/SqFt · ▼6.6% | 10/2/2610/2 |
| 4500 Sheridan AvenueHome 3 bed · 1,554 SqFt | $2,295,000$1,477/SqFt | 10/23/2610/23 |
| 3760 Royal Palm AvenueHome 4 bed · 1,908 SqFt | $2,250,000$1,179/SqFt · ▼6.2% | 10/14/2610/14 |
| 524 W 47th StUnder ContractHome 4 bed · 2,071 SqFt | $1,995,000$963/SqFt | 8/23/268/23 |
| 4322 Alton RoadHome 3 bed · 1,984 SqFt | $1,990,000$1,003/SqFt | 10/22/2610/22 |
| 3050 Alton RoadHome 5 bed · 2,338 SqFt | $1,965,000$840/SqFt · ▼14.4% | 10/6/2510/6/25 |
| 1728 Lenox AvenueHome SiteHome Site — bed · — SqFt | $1,900,000 · ▼5.0% | 2/12/262/12 |
| 1728 Lenox AvenueHome SiteHome Site — bed · — SqFt | $1,900,000 · ▼24.0% | 2/12/262/12 |
| 3719 Sheridan AvenueHome 3 bed · 1,608 SqFt | $1,890,000$1,175/SqFt | 9/9/269/9 |
| 535 W 31st StHome 0 bed · 2,240 SqFt | $1,675,000$748/SqFt | 8/14/268/14 |
Pending Sales
Under contract, awaiting closing. Once the property has closed, the sold price will be available.
| Building ⇅ | Price ⇅ | Pending ⇅ |
|---|---|---|
| The Pines And The PalmsUnit 8 1 bed · 610 SqFt | $359,000$589/SqFt | 10/16/2610/16 |
| Pinetree ManorUnit 5 2 bed · 1,128 SqFt | $495,000$439/SqFt | 10/7/2610/7 |
| The Esquire House Of MUnit 2 1 bed · 750 SqFt | $260,000$347/SqFt · ▼20.0% | 10/6/2610/6 |
| The MantellUnit 432 0 bed · 250 SqFt | $150,000$600/SqFt · ▼11.2% | 9/28/269/28 |
| The Pines And The PalmsUnit 4 1 bed · 620 SqFt | $349,900$564/SqFt · ▼2.8% | 7/21/267/21 |
| 4730 PinetreeUnit 08 1 bed · 500 SqFt | $165,000$330/SqFt | 6/4/266/4 |
6 condos under contract in Central Homes and Nautilus
| Address ⇅ | Price ⇅ | Pending ⇅ |
|---|---|---|
| 4354 Alton RoadHome 4 bed · 2,874 SqFt | $3,399,000$1,183/SqFt · ▼6.7% | 10/29/2610/29 |
| 4475 N Meridian AvenueHome 4 bed · 3,451 SqFt | $8,300,000$2,405/SqFt · ▼11.7% | 10/2/2610/2 |
| 4595 N Jefferson AvenueHome 4 bed · 3,012 SqFt | $3,300,000$1,096/SqFt · ▼16.5% | 9/21/269/21 |
| 4430 Royal Palm AvenueHome 4 bed · 2,629 SqFt | $3,950,000$1,502/SqFt · ▼10.2% | 8/9/268/9 |
| 4730 Pine TreeHome 1 bed · 500 SqFt | $165,000$330/SqFt | 6/4/266/4 |
5 homes under contract in Central Homes and Nautilus
Recently Sold Homes
Sorted by date.
| Building ⇅ | Sold Price ⇅ | % of Ask ⇅ | Closed ⇅ |
|---|---|---|---|
| 1853 Jefferson AvenueUnit 6 3 bed · 1,430 SqFt | $951,000list $995,000 | 96% | 10/29/2610/29 |
| Bel Aire on the OceanUnit 804 1 bed · 667 SqFt | $660,000list $748,000 | 88% | 9/30/269/30 |
| Royal Palm VillasUnit 205 1 bed · 750 SqFt | $280,000list $285,000 | 98% | 9/29/269/29 |
| Meridian LoftsUnit 426 1 bed · 966 SqFt | $533,500list $570,000 | 94% | 9/11/269/11 |
| Kim AimeeUnit 4017 3 bed · 1,096 SqFt | $649,995list $649,995 | 100% | 9/10/269/10 |
| Ritz-Carlton ResidencesUnit 315 2 bed · 1,826 SqFt | $2,655,000list $2,799,000 | 95% | 9/1/269/1 |
| The Pines And The PalmsPH 2 bed · 1,320 SqFt | $675,000list $699,000 | 97% | 8/28/268/28 |
| Ocean LakeviewUnit 201 2 bed · 1,300 SqFt | $530,000list $550,000 | 96% | 8/25/268/25 |
All 55 condo sales in Central Homes and Nautilus · 12 months
Every condo sale in Central Homes and Nautilus since 2012 · 920 sales
| Address ⇅ | Sold Price ⇅ | % of Ask ⇅ | Closed ⇅ |
|---|---|---|---|
| 4480 Nautilus DriveHome 4 bed · 2,371 SqFt | $1,985,000list $2,095,000 | 95% | 10/14/2610/14 |
| 2974 Old Alton RoadHome 5 bed · 3,770 SqFt | $2,700,000list $2,990,000 | 90% | 10/13/2610/13 |
| 4531 Sheridan AvenueHome 4 bed · 1,855 SqFt | $1,850,000list $1,950,000 | 95% | 10/6/2610/6 |
| 4550 N Jefferson AvenueHome 5 bed · 4,000 SqFt | $6,800,000list $7,175,000 | 95% | 9/30/269/30 |
| 4535 N Jefferson AvenueHome 3 bed · 1,992 SqFt | $2,125,000list $2,395,000 | 89% | 9/22/269/22 |
| 4504 Sheridan AvenueHome 5 bed · 3,646 SqFt | $5,750,000list $5,800,000 | 99% | 9/11/269/11 |
| 1729 Lenox AvenueHome 3 bed · 2,170 SqFt | $2,650,000list $2,795,000 | 95% | 8/19/268/19 |
| 2436 Flamingo DriveHome SiteHome Site — bed · — SqFt | $2,700,000list $4,500,000 | 60% | 8/17/268/17 |
All 60 home sales in Central Homes and Nautilus · 12 months
Every home sale in Central Homes and Nautilus since 2012 · 1,116 sales
Map
Nearby
Averages are weighted as total dollars over total square feet. We calculate averages based on closed sales in the MLS for the past 12 months, as of October 29, 2026. Averages are based on properties that are listed or sold for $350,000 and greater. Additional reports at all price points are available here. Price-per-square-foot figures are rounded to the nearest dollar, up or down. Where fewer than 5 closed sales exist in the window, we report the count rather than an average.
| Condos · Avg Selling Price | $951/SqFt · 55 sales |
|---|---|
| Homes · Avg Selling Price | $1,241/SqFt · 55 sales |
| Asking today, all prices | $149,500 to $39,995,000 |
The page above reports from $350,000; this table has no price floor. Same 12-month window, same exclusions before 1990, same minimum sample of 5.